
By Alex Firdaus · Updated June 2026 · Data checked June 2026
Best Trading Indicators for Funded Traders (2026)
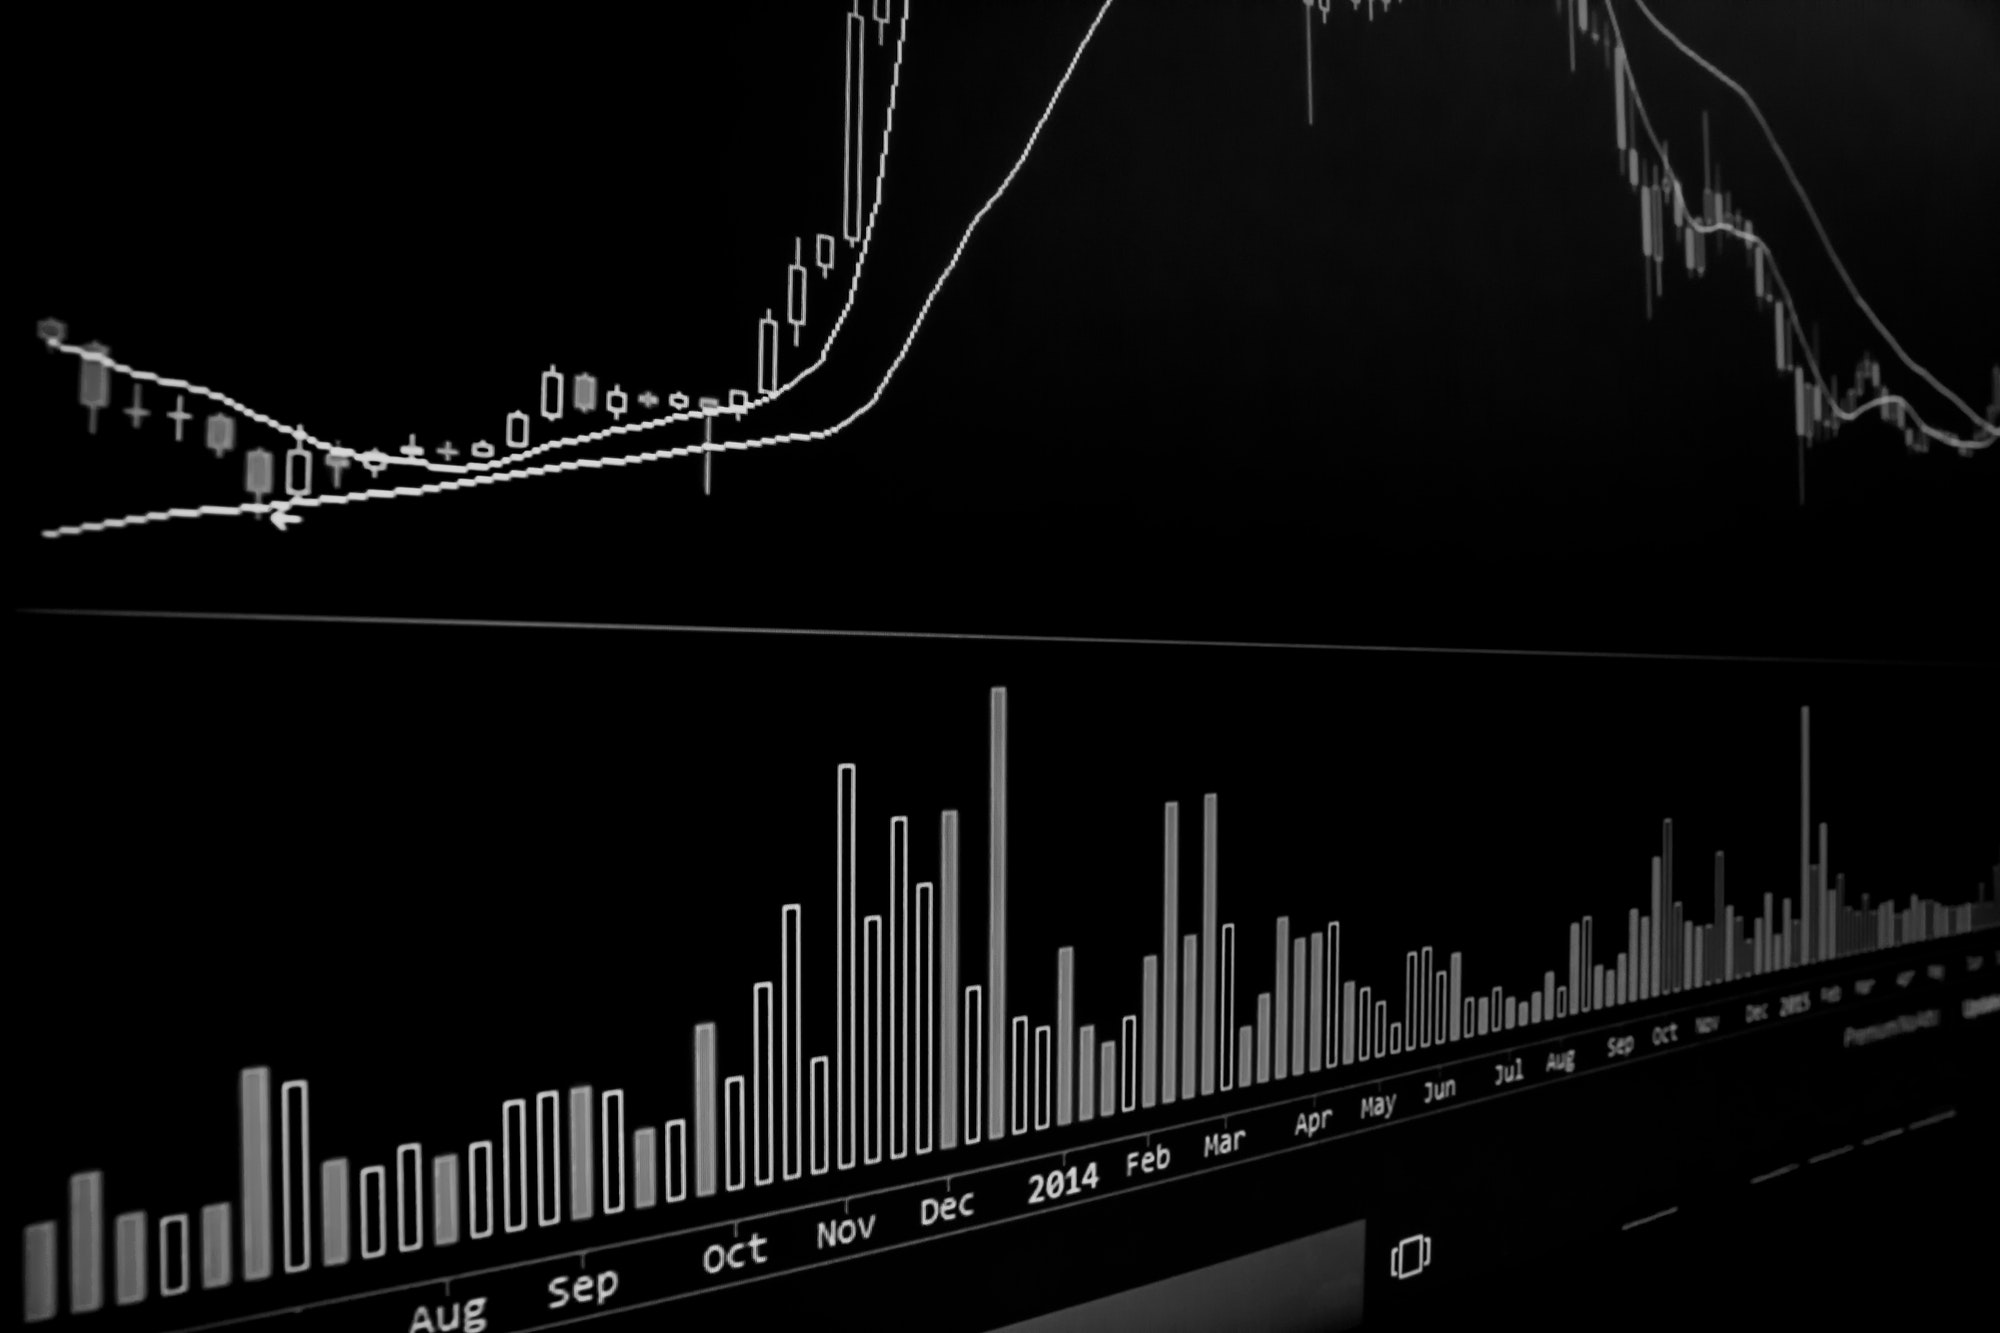
Quick answer: The indicators that matter most in a prop firm challenge are the ones that help you control drawdown — not the ones that generate the most signals. ATR for stop sizing, VWAP or EMA for trend context, and RSI for momentum confirmation cover most funded trading setups. Use two or three at most.
Table of Contents
Why indicators work differently in prop trading
In standard retail trading, a losing run hurts your account balance. In a prop firm challenge, a losing run can end your account permanently — even if you recover from it later in the same day. That changes how you use indicators.
The core risk in a challenge is not being wrong on a trade. It is being wrong at the wrong size at the wrong time and touching the daily drawdown limit. Most prop firms set this at 4% to 5% of the starting account balance. FTMO‘s challenge uses a 5% daily loss cap. FundingPips, The5ers, FundedNext, and FXIFY use similar numbers. Hit that limit and your challenge resets or terminates.
This means your indicator setup needs to do two things at once: generate entries with a reasonable edge, and keep your position sizing tightly controlled so a normal losing streak cannot blow the daily limit in three trades.
The difference between what most beginner traders run and what funded traders actually converge on comes down to this shift in priority. Beginner traders stack RSI on MACD on Bollinger Bands and wait for all three to agree. Funded traders pick one trend filter, one entry trigger, and use ATR to define every stop and position size — then leave the chart alone.
The indicators at a glance
| Indicator | Primary use in prop trading | Platforms | Best for |
|---|---|---|---|
| ATR | Stop sizing and position sizing | MT4, MT5, TradeLocker, DXtrade, TradingView | All challenge types |
| VWAP | Intraday trend bias and entry reference | MT5, TradingView, cTrader | Intraday / day trading challenges |
| EMA | Trend direction filter | MT4, MT5, TradeLocker, DXtrade, TradingView | Swing and intraday challenges |
| RSI | Momentum confirmation and divergence | MT4, MT5, TradeLocker, DXtrade, TradingView | Range and trend setups |
| MACD | Momentum shifts and trend confirmation | MT4, MT5, TradeLocker, DXtrade, TradingView | Swing trading challenges |
| Bollinger Bands | Volatility context and mean reversion entries | MT4, MT5, TradeLocker, DXtrade, TradingView | Range-bound markets |
| Volume Profile | Key support/resistance levels from traded volume | TradingView, Sierra Chart, NinjaTrader, cTrader | Futures challenges, advanced setups |
1. ATR — Average True Range
ATR is the most practically useful indicator in a prop firm challenge. It measures how much a market moves on average over a set number of bars — usually 14 periods. That number becomes the foundation for every stop-loss and position size calculation. Investopedia’s ATR guide covers the original J. Welles Wilder formula if you want the full technical background.
This is how funded traders stay inside the daily drawdown limit across multiple trades. If you have a $100,000 account with a 5% daily loss cap, your daily budget is $5,000. Trading 1% risk per trade means you can take five losing trades in a row before hitting the daily limit. That buffer is what keeps challenges alive through normal drawdown periods.
How to apply ATR in a challenge
Set ATR to 14 periods. Multiply the reading by 1.5 to 2 for your stop-loss distance. Divide your risk amount (1% of account) by the stop in dollar terms to get your lot size. Do this before every trade — not after you enter. On volatile instruments like gold (XAUUSD) or indices like US30 and NAS100, ATR-based stops prevent the single-trade wipeout that ends more challenges than bad strategy does. Before choosing which firm to challenge, check the latest prop firm discount codes to reduce your entry cost.
Why it works in prop trading
- Adapts stop-losses to current volatility automatically
- Makes position sizing precise, not guesswork
- Built into MT4, MT5, TradeLocker, DXtrade, and TradingView
- Keeps you inside daily drawdown across multiple losing trades
Limitations to know
- Does not generate entries — only informs stop placement
- During high-impact news, ATR spikes and inflates stop sizes
- Requires recalculation on each trade — not automatic
2. VWAP — Volume Weighted Average Price
VWAP shows the average price paid for an asset weighted by volume across the current session. It resets at the start of each trading day, which makes it relevant for intraday challenge traders rather than swing traders holding positions overnight.
VWAP is widely available on TradingView and cTrader natively. On MetaTrader 5, it requires an add-on indicator but is broadly available through the MT5 marketplace. On TradeLocker, VWAP is built in as a standard tool. It is not available natively on MetaTrader 4.
VWAP and challenge consistency rules
Some prop firms require a minimum number of winning days or set consistency requirements — for example, no single day’s profit can exceed 30% of total profits. Trading with VWAP as a session filter tends to produce more consistent daily results because it keeps you aligned with where institutional activity is concentrated. Taking trades away from VWAP — in low-volume zones — is where false breakouts are most common and where challenge accounts take unnecessary hits. Firms with no consistency rule give you more flexibility — see our list of instant funding prop firms if you prefer to skip the evaluation phase entirely.
3. EMA — Exponential Moving Average
The Exponential Moving Average weights recent price data more heavily than older data, making it faster to react to trend changes than a Simple Moving Average. For prop firm challenges, the EMA serves one primary job: telling you which direction trades should go.
The 200 EMA is commonly used by long-term traders to define the macro trend, but in a short challenge window (30 to 60 days), it moves too slowly to be practically useful for entries. Stick to 20 or 50 for challenge work.
EMA crossovers — where a shorter EMA crosses above or below a longer one — can signal trend shifts. The classic setup is the 20/50 EMA crossover on the 4H chart as a swing entry signal. It is a lagging confirmation, not a leading signal, so enter on the first pullback after the crossover rather than chasing the initial move. EMA works across every platform — MT4, MT5, TradeLocker, and cTrader all include it as a built-in standard indicator.
4. RSI — Relative Strength Index
RSI measures momentum by comparing recent upward price moves to recent downward moves. It runs on a scale of 0 to 100. Readings above 70 are traditionally considered overbought and readings below 30 oversold — but in prop trading, the most reliable use of RSI is divergence, not the overbought/oversold levels themselves. RSI was developed by J. Welles Wilder and published in 1978 — it remains one of the most widely used momentum oscillators across all markets.
In trending markets during a challenge, overbought and oversold RSI readings are nearly useless. Price can stay above 70 for hours in a strong trend. Buying a “70 RSI sell signal” in an uptrend is one of the fastest ways to accumulate losing trades and blow the daily limit. RSI in trends is better read as momentum confirmation — above 50 supports longs, below 50 supports shorts.
RSI settings for prop challenges
The default 14-period RSI is appropriate for most challenge timeframes. On faster scalping setups using 5-minute or 15-minute charts, some traders use RSI at 7 or 9 periods for more responsive signals. The trade-off is more false signals in choppy conditions. Unless you have specifically backtested shorter RSI periods on your setup, keep it at 14.
5. MACD
MACD (Moving Average Convergence Divergence) compares two EMAs — typically the 12-period and 26-period — and plots the difference as a histogram. A signal line (9-period EMA of the difference) triggers crossover signals. When the MACD line crosses above the signal line, momentum is shifting bullish. Below is bearish.
MACD is a lagging indicator. By the time the crossover happens, part of the move is already in. For prop firm challenge trading where you need to hit a profit target (typically 8% to 10%) within a fixed period, MACD tends to work better on higher timeframes (4H, daily) where the trades have room to run. On 15-minute charts, MACD signals are slow and often arrive too late to be useful.
MACD and minimum trading day requirements
Many prop firms require a minimum number of trading days — typically 5 to 10 — to pass a challenge. Swing traders using MACD on 4H or daily charts may find they take fewer total trades and still meet the day count. This is intentional: firms use minimum day requirements to screen out traders who get lucky on one or two large trades rather than demonstrating consistent risk management. If minimum day rules are a concern for your style, compare firms side by side on our prop firm comparison page — several firms on our best US prop firms list have no minimum day requirement at all.
6. Bollinger Bands
Bollinger Bands place two standard deviation bands above and below a 20-period moving average. When the bands contract (squeeze), volatility is low and a breakout is likely. When price touches the outer band and returns toward the middle, it signals mean reversion. Bollinger Bands were developed by John Bollinger in the 1980s and remain a standard feature on every major trading platform.
The “Bollinger Bounce” — where price touches the outer band and reverts to the middle — works well in range-bound markets. In a trending market, price can walk along the upper or lower band for extended periods, making the touch-and-revert setup unreliable. Check whether the market is trending (price moving directionally with clear structure) or ranging (price oscillating between highs and lows) before applying this setup.
Bollinger Bands are less useful in fast-moving markets like gold or NAS100 during high-impact data releases. During news spikes, the bands expand dramatically but the expansion is caused by a single candle, not a genuine volatility shift. Trading the bands around news releases is a fast way to get caught on the wrong side of a 50-pip reversal — exactly the kind of event that ends a challenge day.
7. Volume Profile
Volume Profile plots the total volume traded at each price level over a selected period, creating a horizontal histogram on the chart. Areas of high volume (called High Volume Nodes or HVNs) act as price magnets and strong support/resistance. Areas of low volume (Low Volume Nodes or LVNs) are areas where price tends to move through quickly.
Volume Profile is available on TradingView (free and paid tiers), Sierra Chart, NinjaTrader, and cTrader. It is not natively available on MetaTrader 4 or MetaTrader 5 without third-party add-ons, which limits its use on forex-focused prop firm challenges that run exclusively on MT4 or MT5. If your prop firm offers TradingView or cTrader access — as many now do — Volume Profile is worth adding to your setup.
Indicator mistakes that fail prop firm challenges
Most funded account failures are not caused by a bad strategy. They are caused by how indicators get used under the pressure of challenge rules. These are the patterns that show up most often.
Using too many indicators at once
Stacking five indicators and waiting for all of them to align means you take fewer trades, but each one is taken later and with a worse entry price. Worse, when markets move fast — during London open or US economic data releases — analysis paralysis leads to entering late, widening stops, and hitting the daily limit faster than a simpler setup would. Two to three indicators is the practical ceiling for challenge trading.
Trading indicator signals that conflict with the session trend
An RSI oversold signal below 30 during a strong downtrend is not a buy signal — it is confirmation that the trend is strong. Taking that trade, holding it for 30 pips, and getting stopped out for 80 pips is a common pattern in failed challenges. Indicators always need to be read in context of the session trend, not in isolation.
Ignoring ATR when sizing positions
Fixed lot sizing — for example, always trading 0.50 lots — ignores the fact that the same lot size on EUR/USD and on gold (XAUUSD) carries very different risk. Gold can move 200 pips in an hour. EUR/USD might move 50. A 0.50 lot trade on gold with a 100-pip stop risks $500 on a $10,000 account — 5% of the account on one trade. That is the entire daily limit. ATR-based position sizing solves this automatically.
Overtrading to hit the profit target quickly
The fastest way to blow a challenge is to decide you are behind on the profit target and increase position sizes to catch up. The profit target is fixed — typically 8% to 10%. The daily loss limit is also fixed. Increasing size to chase the target means each losing trade now takes a larger percentage of the daily budget. Traders who fail challenges in the final week almost always fail because of this pattern. If cost pressure is part of what drives this, consider starting with a cheaper prop firm challenge — a lower-cost entry reduces the psychological pressure to recover fees quickly.
FAQ
Are trading indicators allowed in prop firm challenges?
Yes. All major prop firms — including FTMO, FundingPips, The5ers, FundedNext, and FXIFY — allow standard technical indicators. Indicators themselves are never a reason for account breach. What gets accounts closed is violating the daily drawdown limit, exceeding the maximum drawdown, or breaking consistency rules — not which indicator you use.
What is the best indicator for passing a prop firm challenge?
ATR (Average True Range) is the single most useful indicator for prop firm challenges because it directly helps you size stops and position sizes relative to current volatility — which keeps you inside daily drawdown limits. Most successful funded traders use ATR for stop placement and position sizing alongside one or two other indicators for entry signals.
How many indicators should you use in a prop firm challenge?
Two to three at most. More indicators create conflicting signals, slower decisions, and overtrading — all of which accelerate drawdown during a challenge. A common setup used by funded traders is ATR for risk sizing, one trend filter (EMA or VWAP), and one momentum confirmation tool (RSI or MACD).
Can indicators cause a prop firm account breach?
Indicators do not cause breaches — position sizing and overtrading do. Using too many indicators leads to analysis paralysis and late entries, which often results in traders widening stops or adding to losing positions. This is one of the most common patterns that leads to hitting the daily loss limit.
What is VWAP and why do funded traders use it?
VWAP (Volume Weighted Average Price) shows the average price weighted by volume for the current session. Funded traders use it as a reference level for entries — buying pullbacks to VWAP in an uptrend and shorting bounces in a downtrend. It also acts as a bias filter: price above VWAP is bullish, below is bearish. VWAP resets at the start of each session, making it relevant for intraday challenge trading.
Does FTMO allow indicators on MetaTrader 5?
Yes. FTMO accounts run on MetaTrader 4, MetaTrader 5, and DXtrade. All three platforms support standard technical indicators including EMA, RSI, MACD, Bollinger Bands, ATR, and VWAP. Third-party indicators from the MetaTrader marketplace are also permitted unless they use automated execution without prior FTMO approval.
What is trailing drawdown and how do indicators help manage it?
Trailing drawdown is a drawdown model where the maximum loss floor rises as your account equity grows. If your account grows from $100,000 to $105,000 and the trailing drawdown is 5%, your new floor moves up to $99,750 — not the original $95,000. ATR-based position sizing helps manage trailing drawdown because it automatically reduces risk per trade as volatility increases, preventing the scenario where a volatile day eats back the gains that raised the floor. Check whether your firm uses trailing or static drawdown on our comparison page before starting.
Find a Prop Firm That Fits Your Trading Style
Compare challenge rules, drawdown models, platforms, and payout terms across 160+ prop firms — all in one place.
Browse All Prop Firms