Best Day Trading Indicators
To continue our post “Funded Trading’s Guide to Technical Indicators”, we have listed the best day trading indicators for funded traders. This is a list of the 7 best trading indicators that are very popular with traders. When using trading indicators, the first rule is that you should never employ too many indicators at once or an indicator alone. Concentrate on a select handful that you believe is most appropriate for your goal, along with your personal evaluation of how an asset’s price has changed over time.
It is essential to bear in mind that a signal has to be validated in some way. Validation can take several forms. If you are getting a “buy” signal from one indicator but a “sell” signal from the price action, you should use other indicators or multiple time frames until your signals are validated.
With that in mind, here is our list of the 7 best day trading indicators:
Moving average (MA)
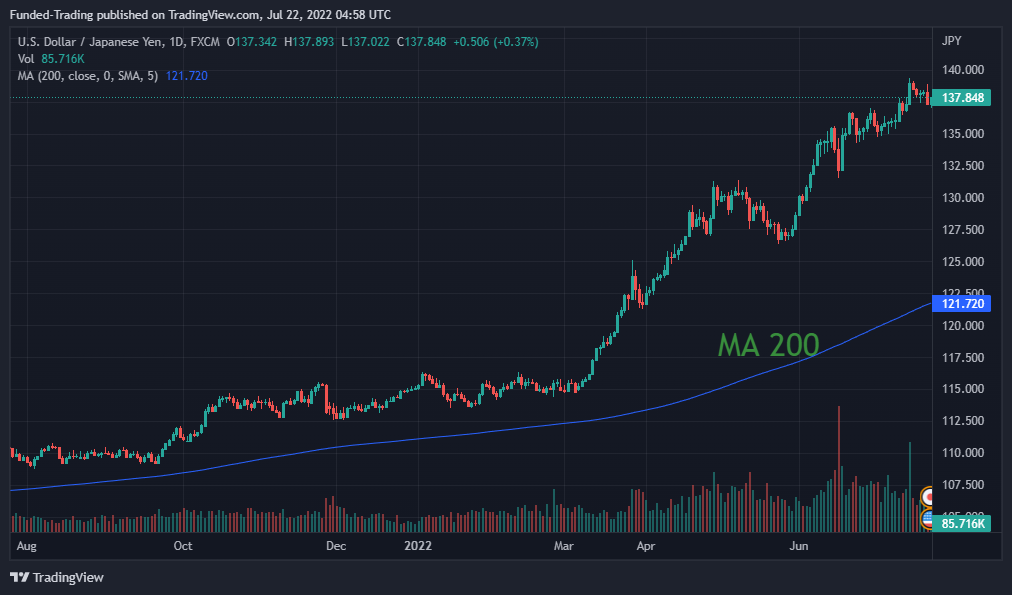
The MA, which is sometimes referred to as the “simple moving average” (SMA), is a tool that is used to determine the direction in which a current price trend is heading without being affected by price variations that are shorter in duration. The MA indicator is used to generate a single trend line by first compiling all of the price points of a financial instrument over a certain period of time, and then dividing that sum by the total number of data points. This process generates a moving average of the prices.
As a day trader, the time and the kind of moving average employed is what’s truly important. For instance, long-term investors utilize moving averages with lengthier time periods, the most popular being 200 days.
Exponential moving average (EMA)
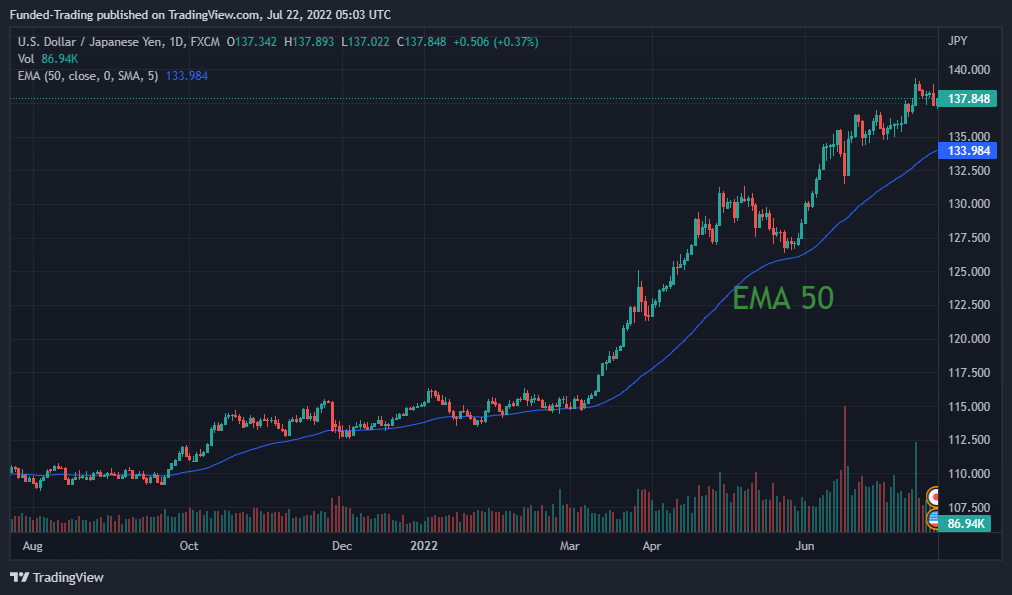
The exponential moving average (EMA) is a lagging indicator that, similar to the basic moving average, may be used to recognize patterns that have developed over the course of time. The simple moving average (SMA) computes the average by applying the same amount of weight to each piece of data, but the exponential moving average (EMA) assigns more weight to more recent trends.
When compared to the SMA, the Exponential Moving Average (EMA) is better able to capture patterns in their infancy because it reacts more quickly to changes in price. When calculating short-term averages, the exponential moving averages of 12 and 26 days are utilized the most frequently; when calculating long-term trend indicators, the exponential moving averages of 50 and 200 days are utilized.
Relative Strength Index (RSI)
By tracking an asset’s price momentum, the relative strength index (RSI) can indicate overbought or oversold conditions. A number between 0 and 100 is used to represent RSI. An asset at the 70 levels is usually seen as overbought, whereas an asset at or near the 30 levels is usually seen as oversold. In other words, the trader should buy an “asset” when it is oversold and short it when it is overbought.

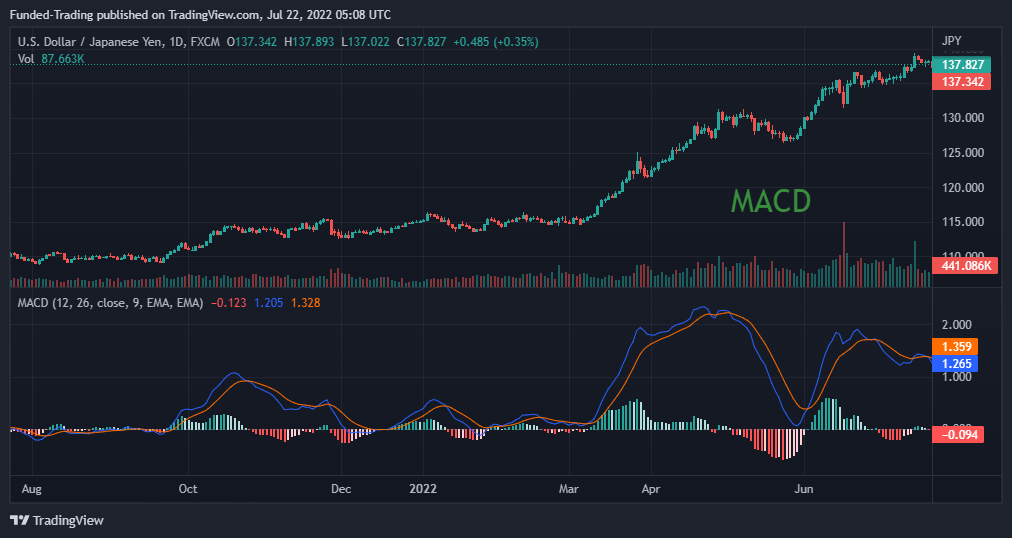
Moving average convergence divergence (MACD)
The MACD indicator compares two moving averages to find changes in momentum. It can aid traders in locating potential buy and sell opportunities near support and resistance levels.
When two moving averages “converge,” they are moving toward one another; when they “diverge,” they are going apart. Momentum is said to be decreasing when moving averages converge but rising when moving averages diverge.
Stochastic Oscillator
A stochastic oscillator is an indicator that assesses the momentum and trend strength of an asset by comparing a given closing price to a range of its values across time. This oscillator tracks the speed of the price rather than the price and volume. With 0 at the bottom and 100 at the top, it is a range-bound indicator. An oversold market is often indicated by a rating below 20 and an overbought market above 80.

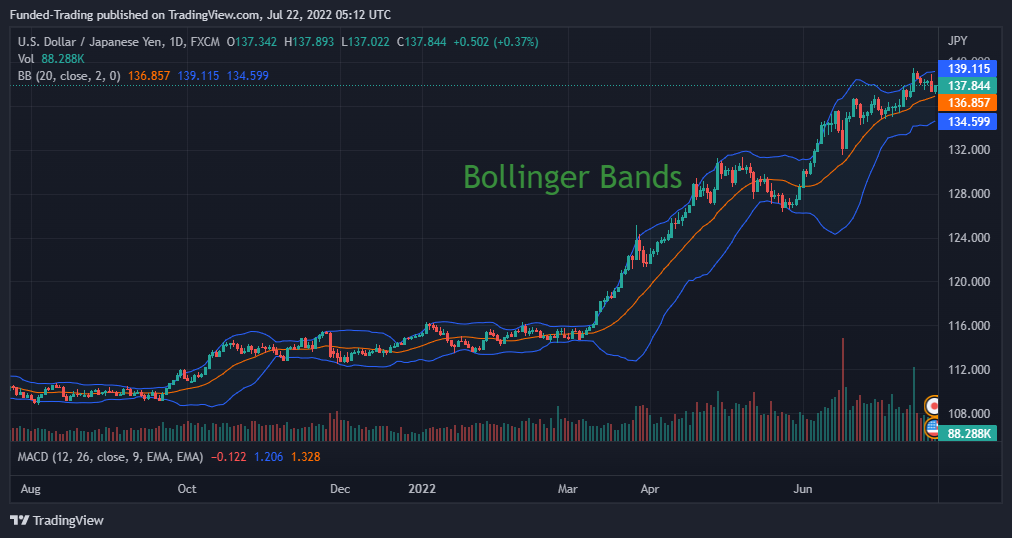
Bollinger Bands
Bollinger bands are a lagging indicator that may be helpful for learning more about volatility and for determining whether prices are generally high or low. The band’s width fluctuates to reflect the recent volatility. The closer the bands are near each other – or the ‘narrower’ they are – the less volatile the asset is. The larger the bands, the more volatile the market is.
A trader can utilize the band produced by these analyses to identify overbought or oversold levels and to get information about a trending price area. When a price swings consistently beyond the top bounds of the band, it may be overbought; when it moves below the lower band, it may be oversold.
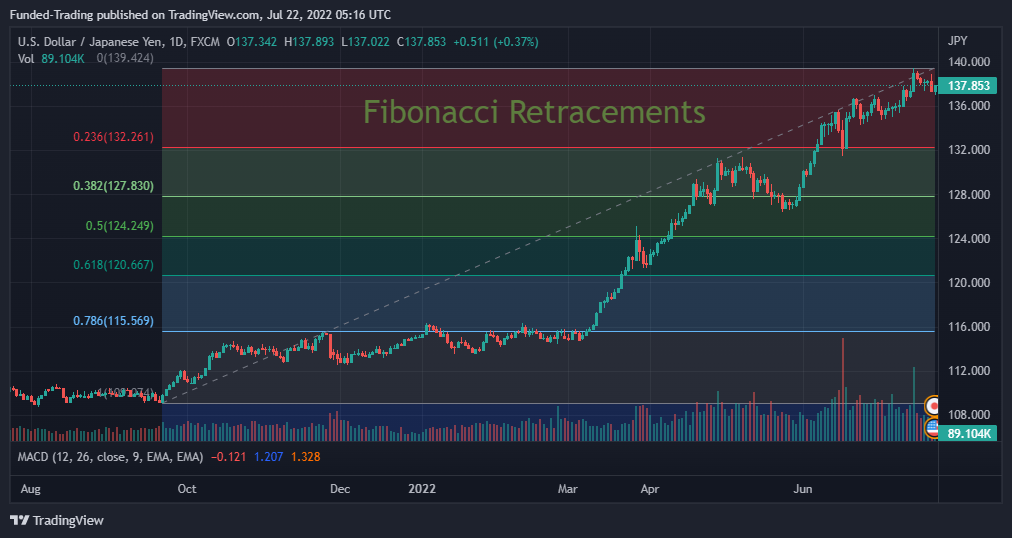
Fibonacci Retracements
The Fibonacci retracement is an indicator that can predict how much a market will deviate from its present trend. When the market temporarily drops, it is referred to as a retracement or pullback.
The Fibonacci retracement is frequently used by traders to corroborate their suspicions that the market is about to move. This is due to the fact that it helps in locating potential points of support and resistance, which may point to an upward or downward trend. This indication allows traders to locate levels of support and resistance, which may assist them in determining where to place stops and limits as well as when to begin and close positions.
Finally
You can decide to display one indication of each type on the screen, possibly two leading and two lagging. Multiple indicators can raise the strength of your trading signals and improve your ability to pick out false signals.
Even when considered “leading” indications, averages and momentum may be easily assessed with the help of indicators, but even then, they aren’t always accurate market predictions. So no matter what you trade, be it forex, commodities, indices, or cryptocurrency trading, always remember to mitigate your risk.
